Smart Money Concept Trading Strategy: Complete Implementation Guide

Table of Contents
- Introduction to the Smart Money Concept (SMC)
- What is Smart Money: SMC Meaning in Trading
- The Core Smart Money Concept
- Market Structure Analysis: The Foundation of SMC
- Structure Break and Change in Price Movement Character
- Order Blocks: Trading in the Footsteps of Major Participants
- Fair Value Gaps: Trading on Market Imbalances
- Liquidity Concepts: Understanding Liquidity Hunts
- Entry and Exit Strategies within the Smart Money Concept
- ICT Trader Tools and Techniques
- Conclusion
- FAQ
Introduction to the Smart Money Concept (SMC)
Have you ever noticed a chart suddenly reverse right where most retail traders had placed their stop-loss orders? This is no coincidence; it’s the work of major players known as Smart Money. Understanding their moves allows you to make trading decisions based on real capital flows, not guesses or random price fluctuations. This foundational idea is at the core of the Smart Money Concept (SMC).
Smart money is the capital of large market participants: investment banks, hedge funds, market makers, and prop firms. They possess:
- Real-time access to order flows, allowing them to see who is buying and selling.
- Analytical teams and systems processing millions of data points every second.
- The ability to create significant market moves that go unnoticed by the average trader.
These players shape the market by creating sequential pushes: they accumulate positions, gather clusters of orders, and trigger powerful market moves. Their approach, defined by the Smart Money Concept, is based on the analysis of market structure, areas of capital concentration, imbalance zones, and key psychological levels.
Example (Gold, 2020)
The price of gold held around $1700. Retail traders considered it “too high” and sold. Meanwhile, Smart Money accumulated long orders. Within months, gold reached $2000. A trader monitoring unusual trading activity and areas of institutional order flow could have joined the smart money and profited.
Michael Huddleston (The ICT Trader) popularized this Smart Money Concept, developing the Power of Three algorithm:
- Accumulation: The gathering of orders without significant price change.
- Manipulation: Creating a false move to “collect stops” and induce order flow.
- Distribution: Taking profit from retail traders and triggering an impulse move.
The ICT Trader’s approach allows you to:
- Read price structure without cluttered indicators.
- Identify key areas of asset concentration and FVG.
- Follow psychological levels and market momentum for precise entries.
- Manage risk and trade efficiency ratios to institutional standards.
This article covers not just theory but also practical cases with calculations, tables, and step-by-step instructions for every SMC trading strategy, so you can apply the methodology to any asset: forex, cryptocurrencies, gold, or stocks. We will delve into the Smart money concept (SMC) Forex strategy and its application across various markets.
What is Smart Money: SMC Meaning in Trading

So, what is a Smart Money Concept? In essence, the SMC meaning in trading refers to a framework that deciphers the actions of large, influential market participants. The SMC meaning in trading is distinct from simply following “big money”; it’s about understanding their strategies and psychological edges.
Smart Money refers to large market participants capable of influencing the direction of price movement. Their key advantages over retail traders are:
- Access to real-time order flow.
- Analytical teams and methods processing vast information arrays.
- The ability to influence the market with significant open interest.
Example (USD/JPY, 2022)
The pair consolidated around 145.00 for a long time. After strong inflation data was published, a price candle closed above this level with anomalous momentum. Retail investors might have seen this as a false breakout, but it signaled a new impulse move by the Smart Money. An entry after a retest of 145.00 offered high trade efficiency.
Smart Money in trading isn’t just “wealthy investors.” They lay the groundwork for an asset’s price change and don’t place orders randomly: every action is tied to the analysis of structure, areas of asset concentration, and market movement zones. This strategic, institutional-level analysis is the true SMC meaning.
Example (XAU/USD, 2021)
Gold formed a bearish zone at 1800–1810. Smart money accumulated long positions stealthily, creating a false downward move. After testing the 1805 level, a buying opportunity opened with a target of 1840. Retail traders, seeing the drop, sold, helping the smart money create a powerful impulse move.
The Core Smart Money Concept
The Smart Money concept is a systematic trading approach focused on the actions of institutional participants. The core idea behind this concept: price rarely moves randomly. Behind most impulses are real capital flows. Understanding what is a smart money concept is the first step to trading like an institution.
An investor applying the smart money concept learns to:
- Analyze market structure through HH, HL, LH, LL.
- Identify clusters of stop-loss and limit orders.
- Determine zones where large capital intervention is likely.
- Analyze market gaps and market movement zones for precise entry.
- Manage risk and stop-loss placement for maximum efficiency.
Example (BTC/USD, 2023)
Consolidation between $26–28k indicated that large players were accumulating buys. After a retest of the 27000 level, the rally to $31,000 began. Understanding the Smart Money concept allowed for entry before the impulse, providing an edge over retail traders.
Example (EUR/USD, 2022)
A sequence of HH and HL on the H4 timeframe indicated a bullish trend. While corrections occurred on lower timeframes, the overall structure remained upward. Opening a position on accumulation zones with a retest of the HL allowed for a risk-reward ratio of 2.0, even if the move seemed unpredictable.
The Smart Money concept helps you see the hidden flow of capital, not rely on indicators and random signals.
Market Structure Analysis: The Foundation of SMC
Market structure is the “skeleton” of price movement. It helps identify where highs and lows are formed and distinguishes random fluctuations from the deliberate actions of Smart Money. Understanding this pattern allows an investor to:
- Track the direction of capital movement.
- Recognize potential accumulation patterns.
- Assess the probability of a breakout or reversal.
Key elements of structure:
- HH (Higher High) – A new high, signaling buyer dominance.
- HL (Higher Low) – A higher low, confirming an uptrend.
- LH (Lower High) – A lower high after a decline; a possible trend change.
- LL (Lower Low) – A new low, indicating a downtrend.
Example (EUR/USD, H4)
The chart shows a sequence of HH and HL. Even with short-term pullbacks, the overall trend remains bullish. Traders following the Smart Money look for initiations after a HL, ensuring a risk-reward ratio ≥ 2.0.
Example (BTC/USD, Daily Chart)
After a series of LL and LH, a bearish trend forms. Entering a short position is recommended after a signal breaking the previous week’s low, with a stop placed beyond the nearest resistance level.
Beginner Mistakes:
- Trying to catch tops and bottoms without considering the structure.
- Relying on indicators without price movement context.
- Ignoring volume and price reaction to key levels.
Advice: Mark key extremes on the daily chart without indicator overload. Within a week, you’ll start to see how Smart Money forms operations and guides an asset’s path.
Table 1. Structure Elements and Trading Actions
| Element | Meaning for the Trader | Recommended Action |
| Higher High | Buyer strength | Enter buys after a HL |
| Higher Low | Confirms uptrend | Retest HL for safe entry |
| Lower High | Possible trend change | Wait for a breakout signal |
| Lower Low | Downward momentum | Enter short after testing the zone |
Structure Break and Change in Price Movement Character
A break of a key level is the moment Smart Money reveals its intentions. A breakout above an old high often signals the start of a buying phase, while a break of support suggests a possible trend change.
Signs of a true breakout:
- Trading activity: Volume significantly exceeds average values.
- Confirmation: The candle closes beyond the level, not just touches it.
- Context: The structure before the breakout confirms readiness for a move.
Example (USD/JPY)
Price held around 145.00 for a long time. After strong inflation data, the upward breakout was accompanied by anomalous activity. Retail traders might have seen the move as false, but the Smart Money concept shows: an entry signal after the 145.00 retest ensured high trade efficiency and reduced risk.
Example (BTC/USD)
The 28000–29500 range held for weeks. After large players accumulated positions, a change upward occurred with confirmation above the level. Entry on a retest of 28900 allowed for a target at 31000, R:R ≈ 2.5.
Example (NASDAQ, Tech Stocks)
The 15100 resistance level was broken with a volume 50% above average. Entry after a retest of 15,120 ensured a safe trade start and minimized risks.
Breakout Trading Mistakes:
- Entering an order on the first touch of a level.
- Ignoring volume and structure.
- Trying to catch the “maximum move” without a confirmation signal.
Table 2. True Breakout vs. False Breakout
| Criterion | True Breakout | False Breakout |
| Volume | Above average | Average or below |
| Candle Close | Beyond the level | Partially beyond the level |
| Context | Confirms the Smart Money trend | Does not confirm the trend |
| Entry | After a retest | On first touch |
Advice: Wait for confirmation—a retest or consolidation—to filter false moves and trading with the real smart money.
Order Blocks: Trading in the Footsteps of Major Participants
An Order Block is the last candle before a strong impulse where Smart Money accumulates its positions. Understanding and correctly identifying these zones allows retail investors to act with the major capital, not against it.
Signs:
- The last candle in the opposite direction before the impulse (e.g., a bearish candle before a sharp rise forms a bullish block).
- Anomalous trading activity.
- A strong move after the price zone, indicating major player involvement.
- Price must move in the direction of the Smart Money after the zone is formed.
Step-by-step model for working with blocks:
- Identify the acceleration phase: Find an asset move ≥1–2 R, accompanied by increased activity.
- Find the last opposite candle: Mark it as a potential zone.
- Wait for the retest: Price returns to the block; check the market’s reaction and participant activity.
- Entry: After confirmation of reaction and volume.
- Stop: Beyond the block zone.
- Target: According to the structure, with R:R ≥ 2.0.
Table 3. Order Block Types and Actions
| Block Type | Signs | Action |
| Bullish | Last price drop + rise | Buy on the return (retest) |
| Bearish | Last price rise + fall | Sell on the return (retest) |
| Complex (Mixed) | Several candles confirming the impulse | Start after proof of reaction |
Additional tips for working with Order Blocks:
- Always check the momentum on the retest to confirm Smart Money participation.
- Apply R:R ≥ 2; don’t try to catch every small impulse.
- Combine blocks with FVG and key liquidity zones for precise entry.
- Record your positions, noting entries, stops, targets, and results.
Practical example of integrating Order Block and FVG:
BTC/USD formed a cluster at 28000–28,200 and a FVG zone at 27,950–28000. After retesting the block, the price entered the FVG, and activity increased by 40%. A trader opened a position at 28050, stop at 27900, target at 30500, winning R:R ≈ 1:4.
Fair Value Gaps: Trading on Market Imbalances
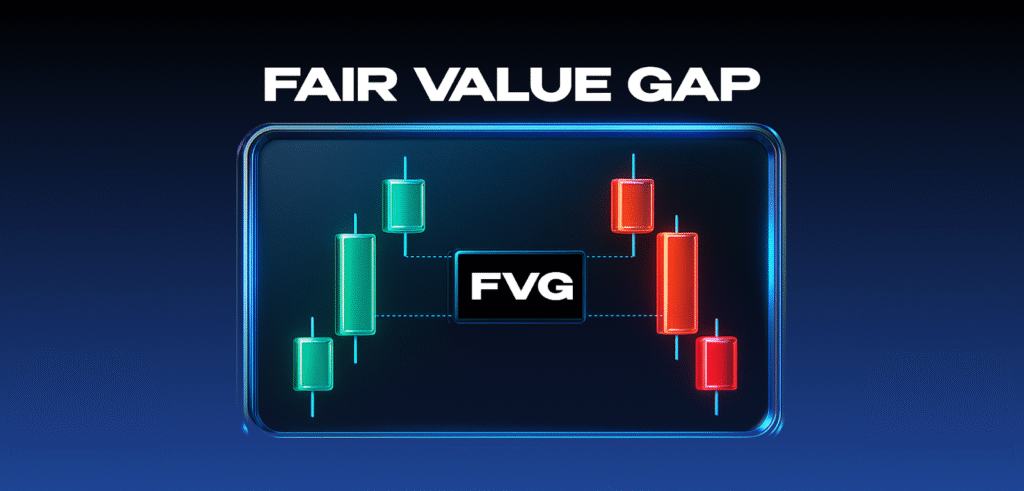
A Fair Value Gap (FVG) is an area on the chart where the price moves too fast, leaving a “gap” between candles. These gaps show that Smart Money has not fully executed its transactions, and the market tends to return to fill this fair value zone.
Understanding FVG allows an investor to:
- Find zones of potential reversal.
- Enter the market at points where institutional players are completing accumulation.
- Manage risk and increase order efficiency.
How to identify a Fair Value Gap:
- On the H1–H4 chart, find a three-candle sequence:
- Candle 1 and 2 create a strong impulse move.
- Candle 3 closes with a “gap” relative to candles 1 or 2.
- Mark the gap between the candles—this is the Fair Value Gap.
- Wait for a retest to confirm Smart Money interest.
Table 4. FVG Types and Trader Actions
| Type | Signs | Action |
| Bullish | Gap after a decline | Buy on the retest |
| Bearish | Gap after a rise | Sell on the retest |
| Complex / Mixed | Several candles with an uneven gap | Entry after a reaction signal |
Methodology:
- Find the gap on the H1–H4 chart.
- Determine the direction of the Smart Money move.
- Wait for the retest.
- Confirm market activity and price reaction.
- Enter in the direction of the major participants.
- Stop: Beyond the FVG boundary.
- Target: Based on the market structure, with a risk-reward ratio ≥ 2.
Practical example of integrating FVG and Order Blocks
BTC/USD formed a FVG at 27951–28001 and an Order Block at 28000–28200. After the retest, the price entered. Market participant reaction grew by 40%. Entry: 28,050, Stop-Loss: 27900, Target: 30500, Risk-Reward ≈ 1:4.
Additional tips:
- Check if the FVG coincides with key liquidity elements.
- Don’t trade just on a visual gap—look for signs of movement and price reaction.
- Combine FVG with Order Blocks, stop zones, and retests for maximum accuracy.
- Keep a trading journal, recording entry, stop, target, intensity, and result.
[IMAGE]
Liquidity Concepts: Understanding Liquidity Hunts
Liquidity refers to the number of orders in the market at specific price levels. Smart Money uses these zones to execute their strategies: they accumulate the stop-losses of retail traders and create impulses in the desired direction.
Understanding liquidity principles allows an investor to:
- Anticipate sharp price movements.
- Identify areas where leading players will act.
- Act in unison with Smart Money, not against them.
Main types of liquidity
- Retail stop-loss orders
- Typically found beyond local highs and lows.
- Smart money uses them to initiate trades.
- Limit orders at key levels
- Executed at important price points.
- Often coincide with FVGs and Smart Money blocks.
- High-activity areas on the chart
- Places where price has reacted multiple times.
- Confirm the importance of a level for dominant players.
Psychology
Retail players often place stops in “obvious” places— beyond local extremes. Smart Money targets these areas to:
- Create false moves.
- Accumulate orders and trigger a powerful impulse.
- Minimize their own risk.
Practical advice: Look for areas of stop-loss and limit order concentration. If price approaches them with increasing activity, prepare for a potential move.
Table 5. Liquidity Zones and Investor Actions
| Type | Signs | Action |
| Stop-Loss Orders | Local highs/lows | Enter after retest with confirmed reaction |
| Limit Orders | Key levels | Use for targets or entry |
| High-Reaction Areas | Repeated price reaction | Confirm level significance |
Integration of Blocks, FVG, and Liquidity (BTC/USD):
- Smart Money Block: 28900–29100
- FVG: 28800–28900
- High-movement zone: 29200
- Retest of Order Block and FVG → confirmation of reaction → entry at 28,950 (buy)
- Stop-Loss: 28800
- Target: 30000
- Risk-Reward ≈ 1:3.5
This approach allows you to act alongside large capital, reducing the risk of trading against the Smart Money direction.
Entry and Exit Strategies within the Smart Money Concept
Trading with the Smart Money concept is built not on random signals but on a systematic approach: a combination of zones, FVGs, high-activity areas, and market structure. Entry and exit strategies help minimize risk and take profit at key levels.
Basic Entry Plan
- On Zone Retest
- Identify an Order Block on H1–H4.
- Wait for a retest with confirmed reaction.
- Entry: After a candle confirms the Smart Money direction.
- Stop-Loss: Beyond the Order Block.
- Target: Nearest key level.
- On FVG Retest
- Find a gap on H1–H4. Wait for a retest with confirmed movement.
- Entry: In the direction of the Smart Money trend.
- Stop-Loss: Beyond the FVG boundary.
- Target: A level from the market structure.
- On Liquidity Zones
- Identify stop-loss and limit order zones.
- Smart money often creates a false move towards these zones.
- Entry: After confirmation of reaction and activity.
- Stop-Loss: Beyond the liquidity pool.
- Target: Nearest Order Block or structure level.
Exit Strategies
- Based on Market Structure
- Use local highs and lows to take profit.
- Suitable for short and medium-term trades.
- Based on Order Blocks and FVG
- When the next zone or FVG is reached, take partial profit.
- Hold the remainder until the next key level.
- Smart Money Trailing Stop
- After a price move of 1–2 R, use a trailing stop beyond local extremes.
- Allows profit-taking while participating in the continuation of the impulse.
Table 6. Entry and Exit Strategies
| Entry Strategy | Exit Strategy | Example R:R |
| Retest | Next block / structure | 1:3 |
| FVG-based | Target based on structure / FVG | 1:4 |
| Liquidity-based | Local extremes + trailing stop | 1:3–1:4 |
Additional tips:
- Don’t use one method without confirmation from other Smart Money tools.
- Always check momentum on the retest.
- For lower timeframes — aim for R:R ≥ 2; for daily charts — ≥ 3.
- Keep a trade log recording zones, FVGs, market activity, entry, stop, target, and result.
ICT Trader Tools and Techniques
Power of Three
- Accumulation: Smart Money accumulates positions without noticeable price movement.
- Manipulation: Creating a false move to collect stops and liquidity.
- Distribution: Realizing profit on small traders and triggering an impulse.
Optimal Trade Entry (OTE)
- Identifies optimal entry points in zones of demand/supply or blocks.
- Helps minimize risk and increase efficiency.
Fair Value Gap (FVG)
- Imbalance zones where Smart Money transactions are not fully realized.
- Used to enter in the direction of institutional capital.
Order Blocks
The last candle before a strong impulse. Signals the accumulation of major players and likely price movement.
Table 7. Integration of ICT Tools
| Tool | Function | Application in SMC Strategy |
| Power of Three | Accumulation, Manipulation, Distribution | Defining Smart Money phases |
| OTE | Optimal entry point | Minimizes risk and increases R:R |
| FVG | Imbalance zones | Used for retests and entry |
| Order Block | Last candle before impulse | Identifies Smart Money accumulation points |
Advanced Application Tips:
- Combine Power of Three, FVG, and Order Blocks for signal confirmation.
- Use OTE to minimize potential risk and maximize R:R.
- Always check liquidity areas and retail stops.
- For volatile assets (crypto, indices, stocks), use daily and H4 charts to filter out noise.
- Record trading results, noting all tools, entry points, stops, and targets.
Conclusion
The Smart Money Concept (SMC) is a systematic trading approach based on the actions of major participants: investment banks, hedge funds, and market makers. Using order blocks, FVGs, liquidity zones, and ICT tools allows a retail investor to:
- Act in unison with institutional capital.
- Minimize risk through retests and activity confirmation.
- Precisely identify high-probability entry and exit points.
- Understand market psychology and the hidden actions of Smart Money.
Practical application includes:
- Analysis of market structure (HH, HL, LH, LL).
- Identification of blocks and Fair Value Gaps.
- Assessment of retail stop-loss and take-profit zones.
- Application of ICT tools: Power of Three, OTE.
- Step-by-step entry and exit algorithms.
- Maintaining a trading journal to monitor results and facilitate learning.
The goal: To act consciously, like Smart Money, not to follow random signals or market noise.
FAQ
What is Smart Money and how do they differ from retail investors?
They are major market participants with access to order flows and analytics, who shape price movement systematically by collecting demand and accumulating operations. This is the core SMC meaning.
What is a Smart Money Concept?
The Smart Money Concept is a trading framework that analyzes the market through the lens of institutional order flow, price action, and liquidity, rather than relying on traditional retail indicators.
How to identify an Order Block on a chart?
It is the last price candle before an impulse with anomalous momentum. Entry is executed on the retest after confirming the market’s reaction.
What is FVG and how to use it?
It is a market imbalance zone formed by the rapid movement of price between candles. It is used for retesting and opening a position in the direction of institutional capital, usually with a risk-reward ratio ≥ 2.
How to combine blocks, FVG, and liquidity in one SMC strategy?
Identify blocks and FVGs on H1–H4, determine stop-loss and limit order zones. Wait for the retest and confirmation of movement. Enter after confirmation, stop beyond the block or FVG zone, target the nearest structure level or the next movement zone.
What is the SMC meaning in trading for risk management?
The SMC meaning in trading for risk management involves using stop-losses beyond key institutional levels (like blocks or FVGs), maintaining a risk-reward ratio ≥ 2, and taking partial profits strategically.
Where to apply the smart money concept — forex, crypto, or stocks?
Universally. The Smart money concept (SMC) Forex strategy is highly popular, but it also applies to crypto (highly volatile assets) and stocks (leading companies and indices). Use daily and H4 timeframes to filter out volatility.


